Tools: Tableau
Superstore Data Dashboard
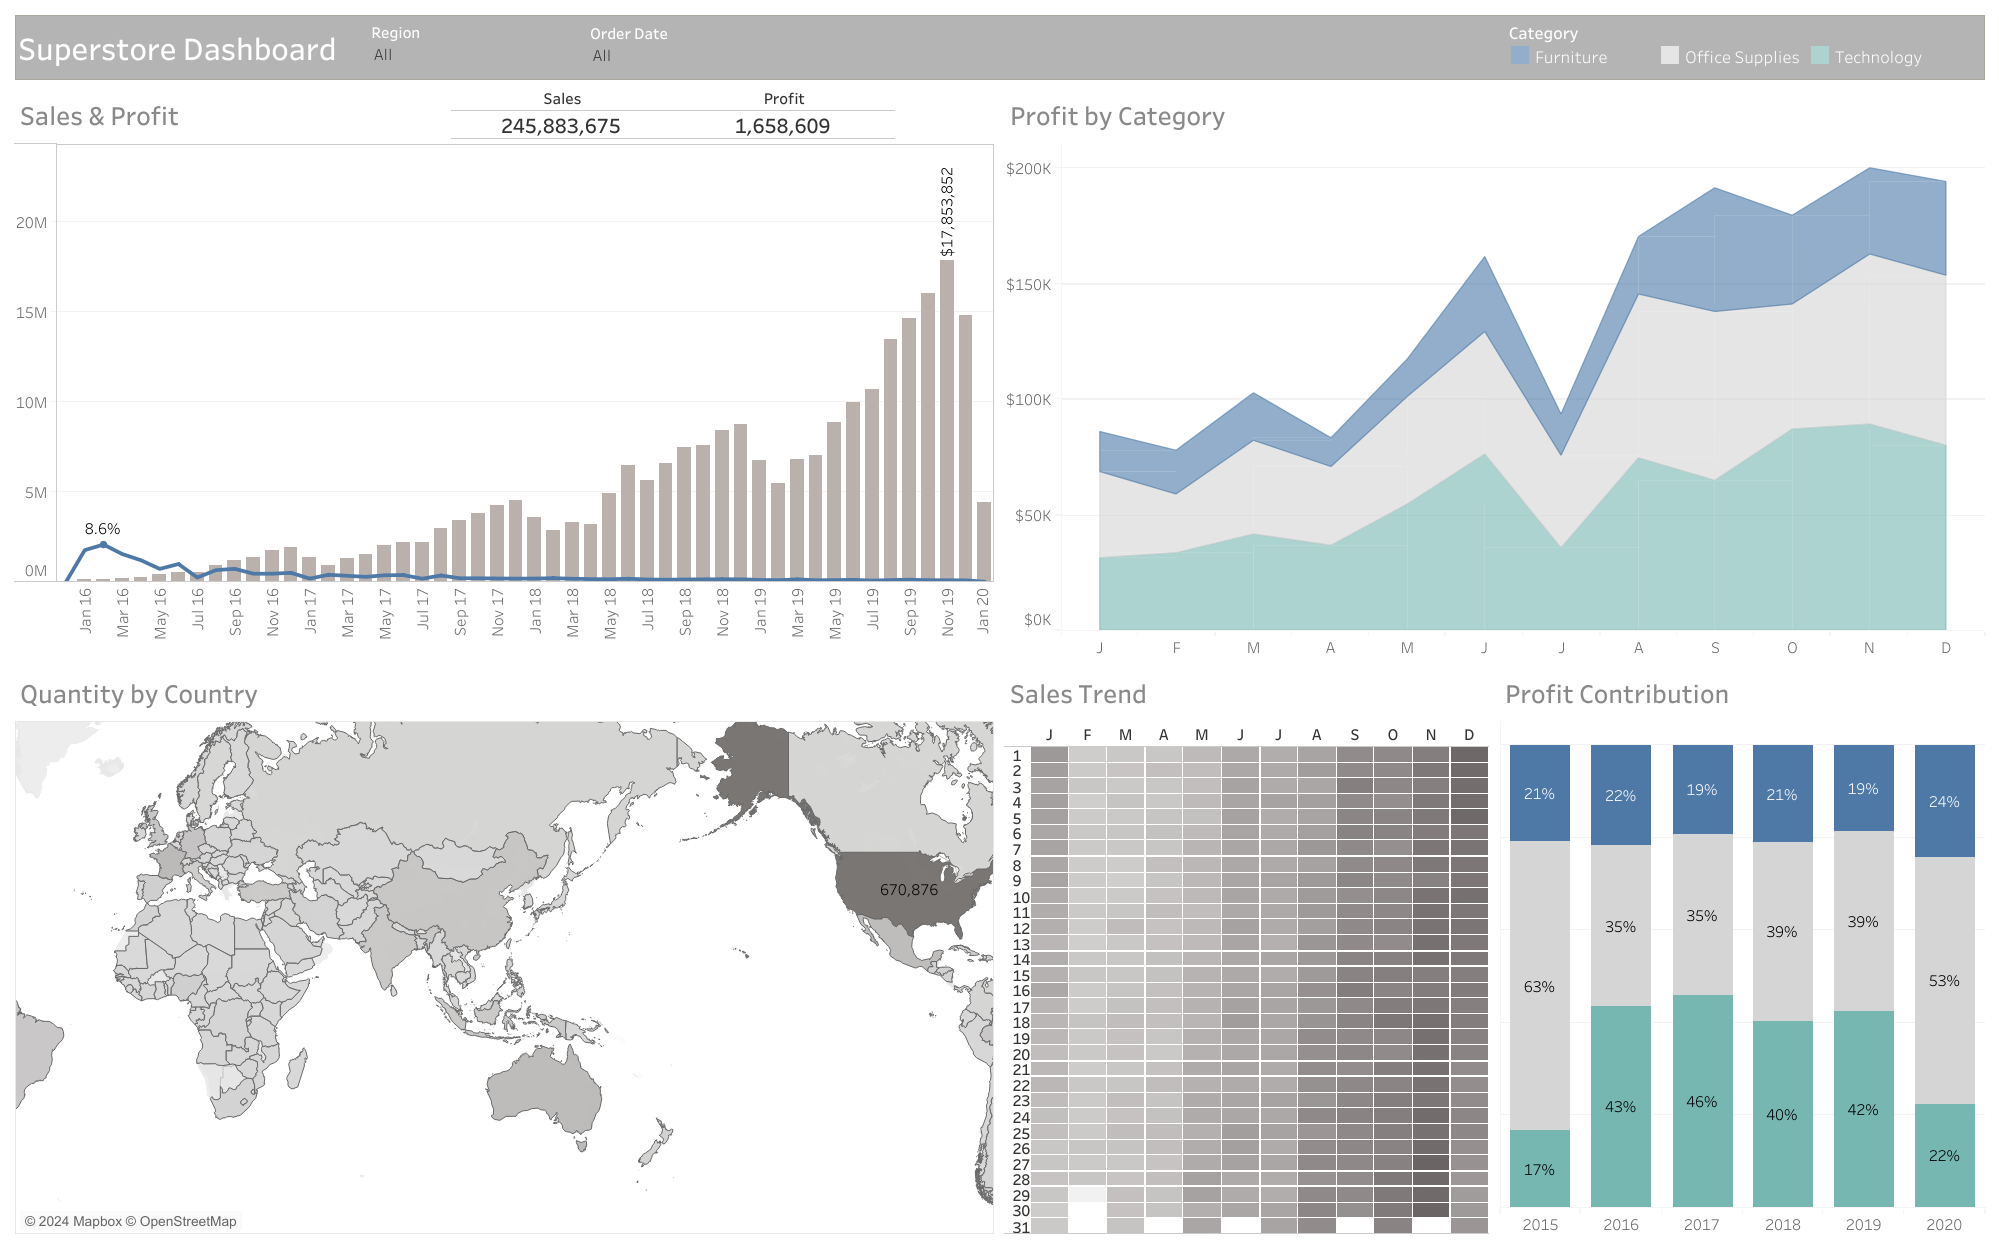
The Superstore Dashboard provides an interactive visualization of key business metrics, including sales and profit figures, detailed profit analysis by category, quantity sold by country, sales trends, and overall profit contributions. Users can explore the data through region and date filters, presented via intuitive drop-down menus, for targeted insights.
DASHBOARD
- Sales & Profit
- Profit by Category
- Quantity by Country
- Sales Trend
- Profit Contribution
